Wondering how to teach NGSS 3-LS4-1? The standard asks third grade students to “analyze and interpret data from fossils to provide evidence of the environments in which they lived long ago.” You can use simulated fossil beds to get the job done. Ask kids to count or measure, graph, and interpret their findings. In no time, you have an effective science and math activity!
Posts on this website follow a teaching journey and are written in story form.
Ms. Sanchez Wonders How to Teach NGSS 3-LS4-1
Our favorite third grade teacher sat at the side table with her teaching partner. She squinted at the standards document on her screen and sighed. “I don’t understand how to teach NGSS 3-LS4-1. It seems like an earth science standard, but instead, it’s under life science.”
“Neither do I,” said Mr. Jones. “Let’s see if we can find a good resource that supports this standard.”
In no time, he opened his laptop and began searching. “Hmm, lots of stuff on fossils, but not how to analyze or interpret data. Hey, wait! Here’s one.”
He turned his screen toward Ms. Sanchez. As she studied the resource, her frown turned upside down. “Looks like you’ve found a winner!”
Introduce Paleontology and Fossils
Mr. Jones scrolled to the beginning of the unit. “First,” he said, “we’ll introduce the job of a paleontologist, as well as types and clues from fossils. That will give the background information kids need for NGSS 3-LS4-1.”

Teach Graphs When You Address NGSS 3-LS4-1
He continued scrolling and found some anchor charts for teaching picture and bar graphs. “Second, we will review picture and bar graphs. I like how these examples include both horizontal and vertical graphs. This interdisciplinary approach reinforces our math standards so well!”

Begin with Simple Fossil Data
On the next few pages, he found a simulated fossil bed and graphs. “It looks like kids begin by counting and graphing types of shells. Wow, just like a paleontologist!”
Ms. Sanchez nodded. “I’m starting to understand the intent of NGSS 3-LS4-1,” she said. “Kids can analyze data from fossils when they have numeric values.”

Ask Kids to Analyze and Interpret Data in Graphs
“Right,” said Mr. Jones, scrolling farther. “After they create graphs, they analyze and interpret the data. As a matter of fact, this resource includes a graph for just that purpose.
“I’m beginning to understand why this standard is under life science, specifically biological evolution. Kids are actually learning about life in ancient environments.”
“Right,” said Ms. Sanchez. “But these two worksheets look identical to me.”
“Look a little closer. The author has included a graph to the nearest ten, as well as one to the exact number.”
“Ahh, this will be perfect for differentiation in my class,” his teaching partner replied.

Include Measurement and Line Plots in Your NGSS 3-LS4-1 Unit
“That’s not all!” said Mr. Jones. “The next set of anchor charts teach kids to measure to the nearest fourth of an inch, as well as about frequency. Students learn to tally measurements, convert the tally marks to numbers in a frequency table, and then create a line plot.”

Measure and Plot Data on Trilobites
Mr. Jones scrolled to the next set of pages. “In this activity, kids measure trilobites, plot the data, and organize it in a line plot.”
“Wow. Just wow,” said Ms. Sanchez. “Our math standards ask kids to plot measurement on line plots. This provides an authentic task. Great!”

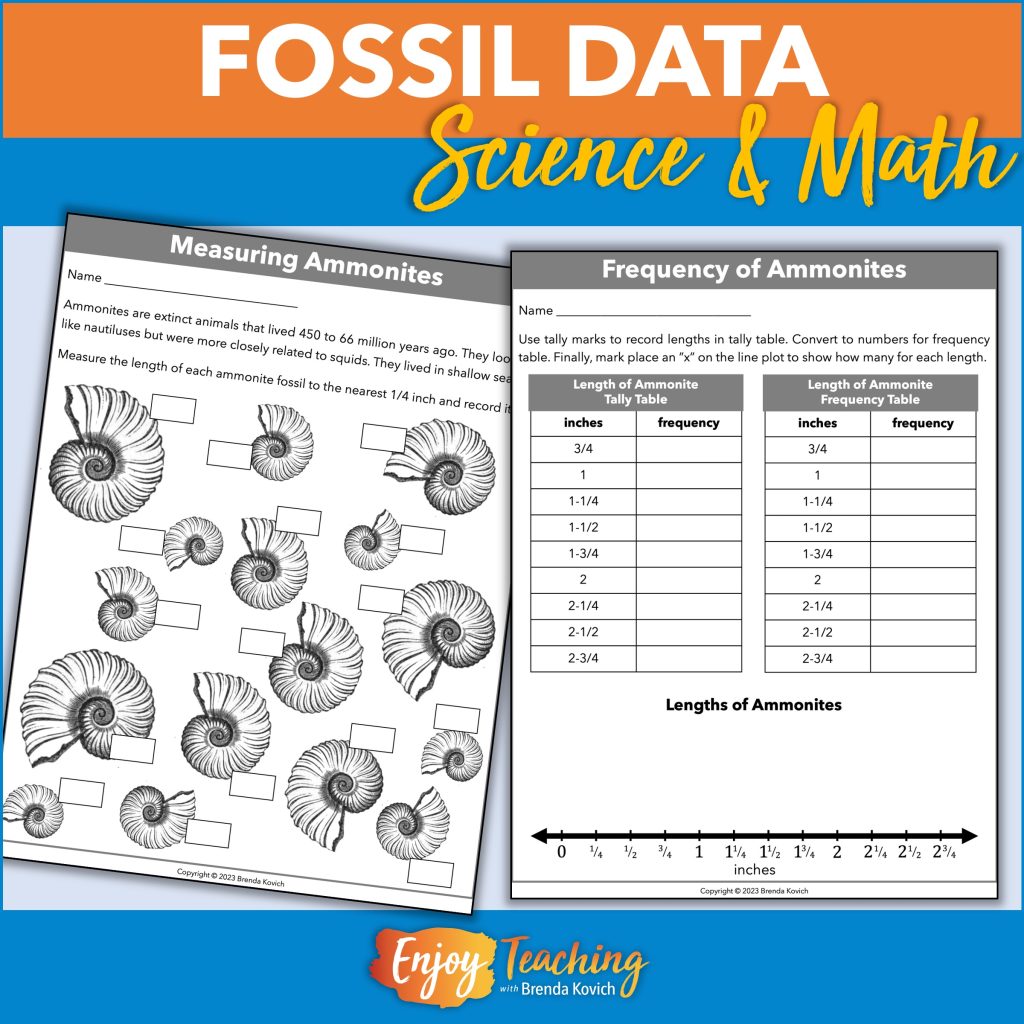
Practice or Assess with Ammonites
“Finally,” Mr. Jones continued, “they do the same with ammonites. We could use this activity for extra practice or as an assessment.”
“This resource meets and exceeds the intent of NGSS 3-LS4-1,” said Ms. Sanchez. “Kids analyze and interpret data from fossils, but they also count, measure, and graph.”

Enjoy Teaching NGSS 3-LS4-1
Ms. Sanchez leaned back in her chair with a sigh – but this time, it was a sigh of relief. “I love this integrated science experience!” she said. “Not only will our kids understand the science standard, but they’ll also practice important math skills.”


