Teach weather maps – with just a little instruction. Read on to find out how your students can read, analyze, and forecast the weather.

Posts on this website follow a teaching journey and are written in story form.
Ms. Sanchez Teaches Weather Maps
While our favorite third grade teacher hung a few posters, her teaching partner put the data sheets in a notebook. “Thanks for helping me set up my classroom weather station. I’m really looking forward to doing these weather and climate activities with our kids.”
“No problem,” Mr. Jones responded. “Tomorrow we’ll set up mine.”
“Now we just need a way to teach our kids how to read the weather maps.”
As usual, Mr. Jones’s laptop was nearby. Wasting no time, he opened it and began clicking around. Soon, he found something.
“Check this out!” Quickly, Ms. Sanchez came over to look at the weather map materials.
Reading Symbols on Weather Maps
Fronts
“First, kids learn symbols for fronts. See? This blue line with triangles represents a cold front. It indicates the leading edge of a cooler air mass replacing a warmer air mass. And hey, cool! I never knew this. Actually, the triangles point in the direction the front is moving.”
“So basically a front just means the front-end of a moving mass of air?” Ms. Sanchez asked.
“Right.” As he studied the sheet, he continued talking. “The red line with half-circles shows a warm front. And again, the semicircles point in the direction the front is moving. Furthermore, this purple line with both triangles and half-circles indicates an occluded front.”
“What’s that?” asked Ms. Sanchez.
“An occluded front,” Mr. Jones read, “occurs when a warm air mass gets stuck between two cold air masses. As the warm air rises, the cold air masses push to the middle. The word ‘occluded’ is used because the warm air mass has been cut out, or pushed up.”
“I like the way the picture on the left shows what that front looks like,” Ms. Sanchez inserted.
“Yeah, and the definitions are succinct.”
“Down here at the bottom, kids will also see the symbol for a stationary front. Although this was made for kids, it helps me understand weather maps too.” Ms. Sanchez smiled. She always loved learning on the job.
High and Low Pressure
Mr. Jones scrolled down to the next page. “Additionally, they learn about symbols for areas of high and low pressure that appear on weather maps.” He pointed to the blue H and the red L.
“Ah,” said Ms. Sanchez, reading a bit of the text on the page. “Now I get it. When an air mass has higher pressure, dense air presses downward and usually causes clear weather. Conversely, when air masses have lower pressure, they get pushed up and clouds form.”

Application of New Skills
Mr. Jones scrolled down a little farther. “Once they’ve learned about the symbols,” he said, “they label them this map.”
Ms. Sanchez nodded. “Actually, these weather maps are perfect for our third graders. And furthermore, it will help me understand the daily weather reports a little better!”
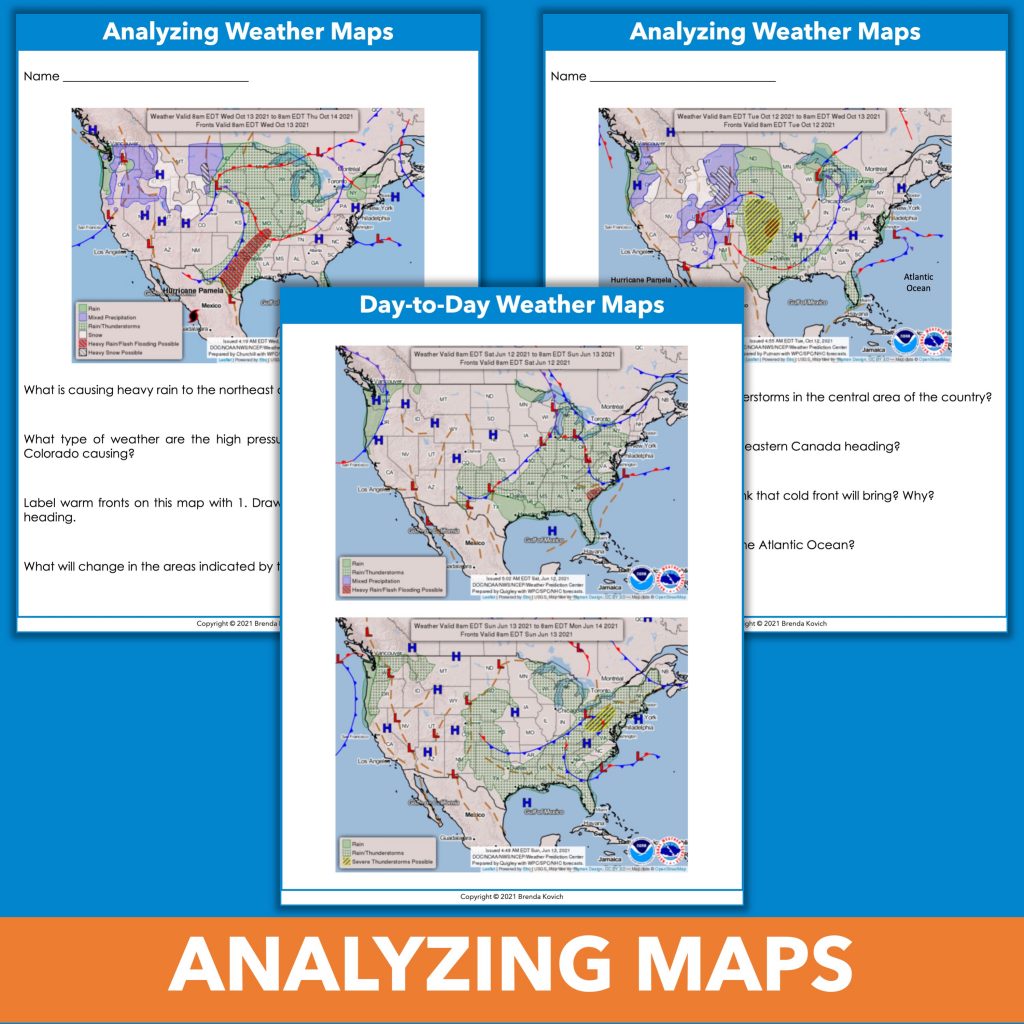
Analyzing Weather Maps
“In the next part,” said Ms. Sanchez, “kids analyze weather maps. Here you see guided questions. Yes, I like the way the teacher eases the students into the process. The maps come in color or grayscale. And a different version asks kids to answer questions as well.”
Mr. Jones studied the guided questions. “At the beginning of this part, the teacher provides some background information. First, warm air holds more moisture than cold air. Second, movement of air masses is driven by fronts. Third, warm fronts can bring broad areas of rain. And fourth, thunderstorms often occur along cold fronts.”
“I like the way they include cardinal and ordinal directions on a map,” said Ms. Sanchez. “For example, I want my kids to find southwest.”
“These National Weather Service maps follow each other for seven consecutive days. That really helps kids understand how weather moves and dissipates.”

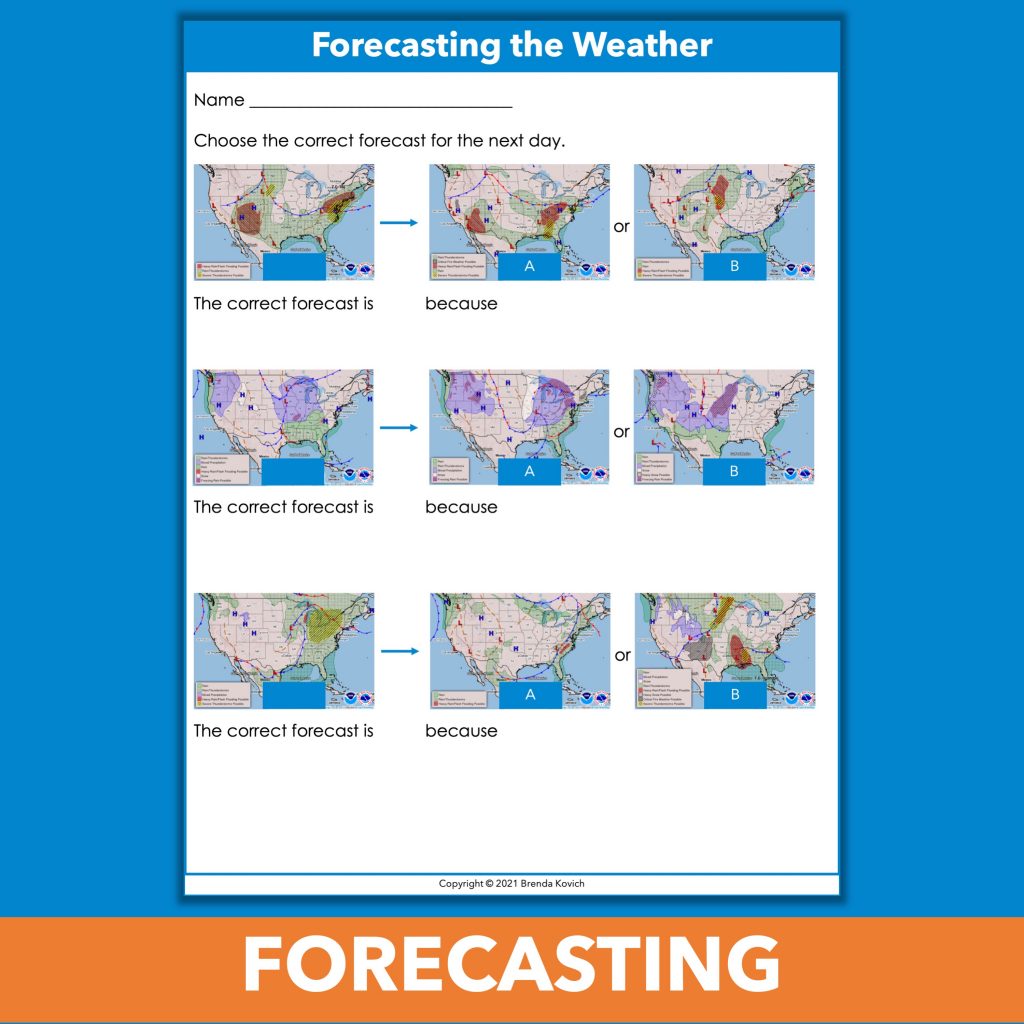
Forecasting
“Finally, kids actually forecast the weather,” said Ms. Sanchez. “Wow, I never thought that would be possible. They begin with weather maps of one day’s weather. Then they have to select a visual of the next day’s conditions.”
“Undoubtedly,” said Mr. Jones, “these weather map materials will prepare our students for their weather station!”
The teachers looked at each other and grinned. It was great when a plan came together.
“Next time we meet, let’s add some climate activities too.”

Enjoy Teaching
What happens when you push yourself to try new things in your classroom? You enjoy teaching earth science even more! Why not teach your kids about weather maps – and even set up your own weather station!